|
 Cretaceous clean and Shaly Sands - Alberta
This example is
Exercise 1 from
Crain's Practical Quantitative Log
Analysis for Conventional Reservoirs - a Video
Course for CEOs, geoscientists, engineers, and
petrophysicists looking to improve their oil-finding skills.
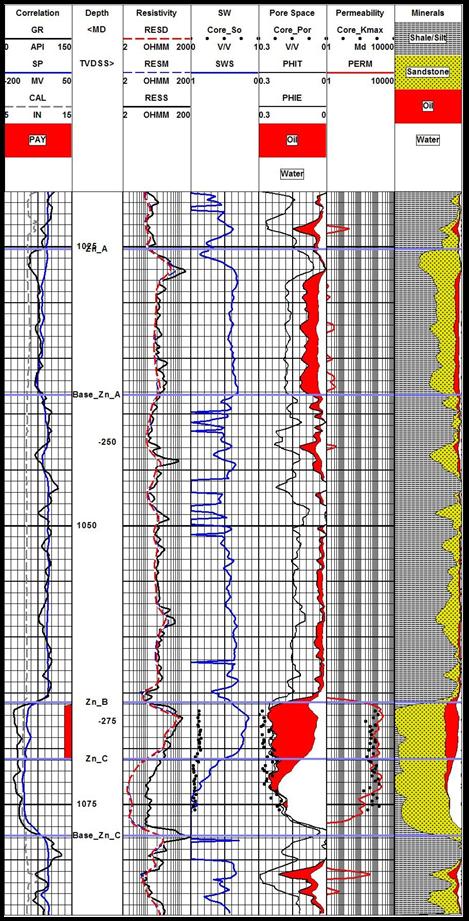
The raw logs show two zones of interest: a lower
clean sand with hydrocarbon over water and a poor quality
upper shaly zone with a hydrocarbon show on logs (bypassed pay?) These zones can
be spotted by laying the density log over the resistivity log
and looking for the crossover of the curves. Because the sands
are not pure quartz, a conventional shaly sand analysis
technique is not appropriate because it would underestimate
porosity, so a complex lithology model was used instead.
There is no density neutron cross over in the
clean sand, so this zone is oil bearing. We cannot tell about
the upper shaly sand because the shale effect masks any possible
gas effect. After shale corrections, the density and neutron
still do not cross over, so oil is most likely.
The water zone at the base of the clean sand
provides water resistivity information for use throughout the
rest of the zone. Core data was available to calibrate porosity
and permeability results. The answer plot shows the results of
the lithology, porosity, and hydrocarbon analysis.
The raw data plot shows two interesting features:
the flat SP compared to GR in tight zones and the SP excess at
3400 feet, indicating better permeability than the rest of the
shaly sand. The lithology track on the answer plot shows this
interval to be more sandy and less limey than the rest of the
shaly sand.
rAW
LOGS and PETROPHYSICAL RESULTS for EXERCISE 1
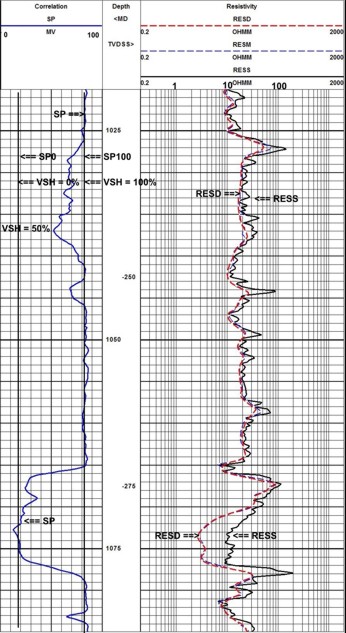 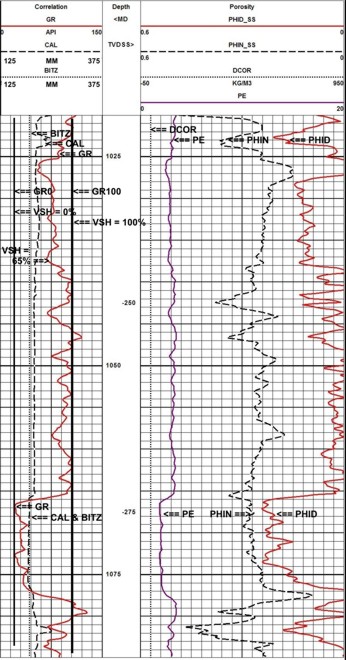
Raw logs for Clean and Shaly Sand
Exercise 1
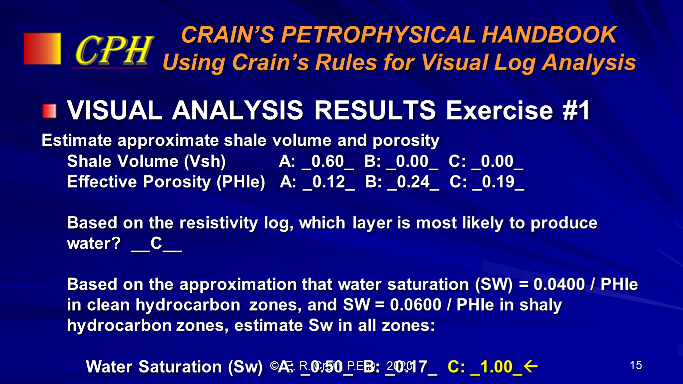
Visual log analysis for Exercise 1, based
on Crain's Rules
Basic depth plot for Clean
and Shaly Sand
Exercise 1
using a commercial petrophysical software package.
META/KWIK QUICKLOOK SPREADSHEET RESULTS for EXERCISE 1
The best tool for quicklook log analysis is a spreadsheet.
Pick parameters and log data from the raw logs shown above. When
data entry is complete, the answers are instantly available.
Download and use these spreadsheets:
SPR-01 META/KWIK Log Analysis Conventional Oil Gas Bitumenn Metric
SPR-02 META/KWIK Log Analysis Conventional Oil Gas Bitumenn USA
Conventional Oil, Gas,Bitumen
-- shale, porosity, saturation, permeability,
net pay, productivity, reserves.
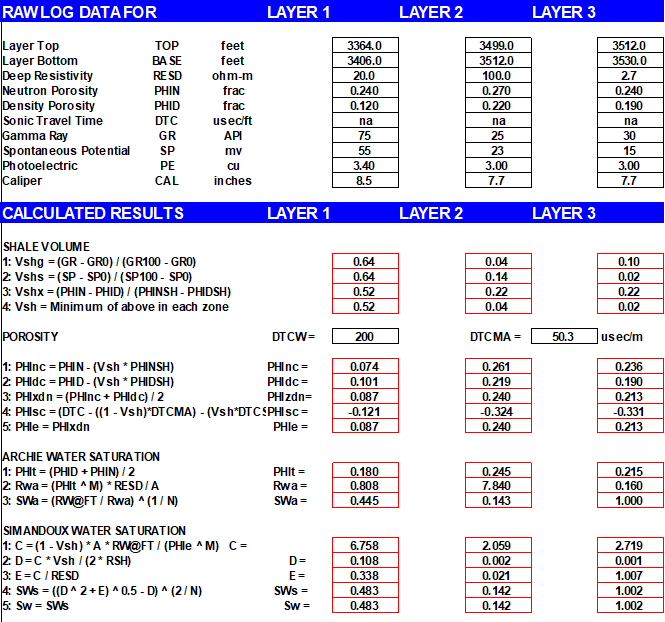
META/KWIK data and results for Exercise 1
"META/LOG ESP" CROSSPLOTS
and
RESULTS for EXERCISE 1
The following crossplots were made using META/LOG ESP, an expert
system on a spreadsheet.
1.
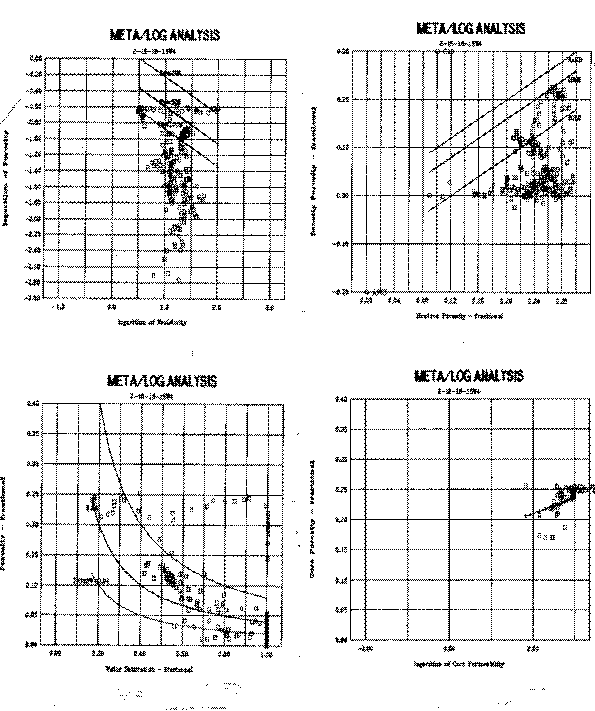
Basic crossplots for Shaly Sand Example - Part 1
Porosity vs Resistivity - shows
water saturation lines (shale data falls below 100% Sw line). Porosity vs Saturation - shows
constant water volume lines. Data streaming above and to the
right indicate transition and water zones. Shale data falls to
the bottom of the graph.
Density vs Neutron - shows all data
below limestone line, indicating either no perfectly clean sand
or mixed lithology sand (GR suggests clean sand). Shale data
falls towards bottom and right.
Core porosity vs core permeability
- shows a data cluster which cannot be used to derive a
regression line mathematically. A line drawn thru the lower left
corner will work fine.
5.
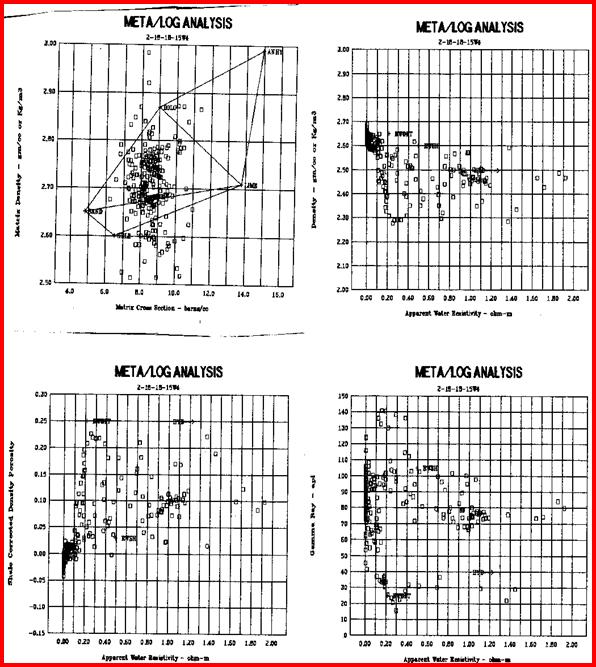
Basic crossplots for Shaly Sand Example - Part 2
Matrix density vs matrix cross
section - confirms that sand is not pure quartz, but the plot
does not tell us which minerals to expect. Sample description
suggests quartz, calcite, and glauconite (plots past anhydrite
at top right).
Apparent water resistivity vs
density - shows RW@FT and RWSH points relative to spread of data
for both shale and hydrocarbon zones.
7.
Apparent water resistivity vs
density porosity - similar to above but uses effective porosity.
Shale plots near origin, water zone at top left, oil at right.
8. Apparent water resistivity vs gamma
ray - shows where to pick GR0 and GR100 (also can be picked from
raw logs). Best oil zone is off scale to the right.
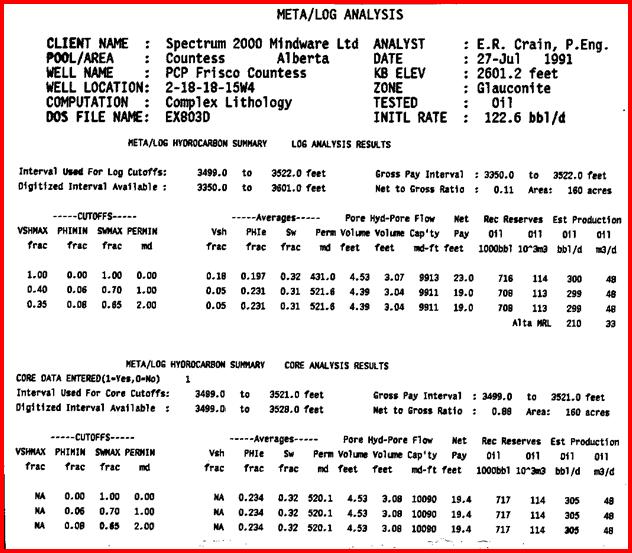
Reports and data listings are an essential part
of log analysis. The next illustration shows the answer report
prepared automatically by META/LOG after the analyst has
finalized the job. The hydrocarbon summary page shows a
comparison with core. The match between porosity and
permeability are extremely good, as they should be.
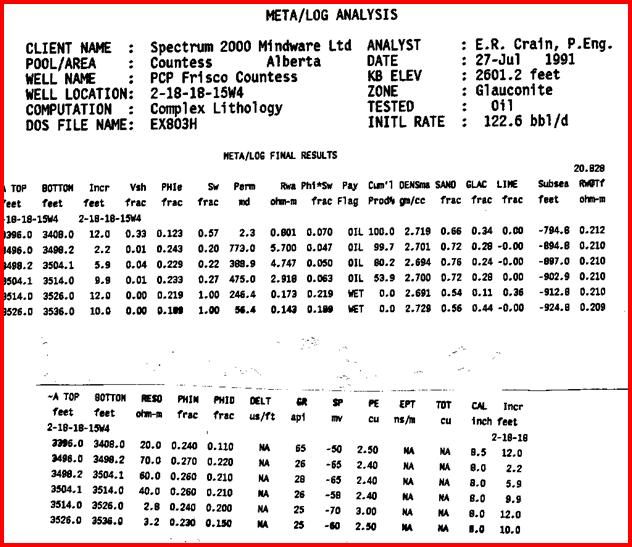
Basic answers and raw data listings for Shaly Sand
Example
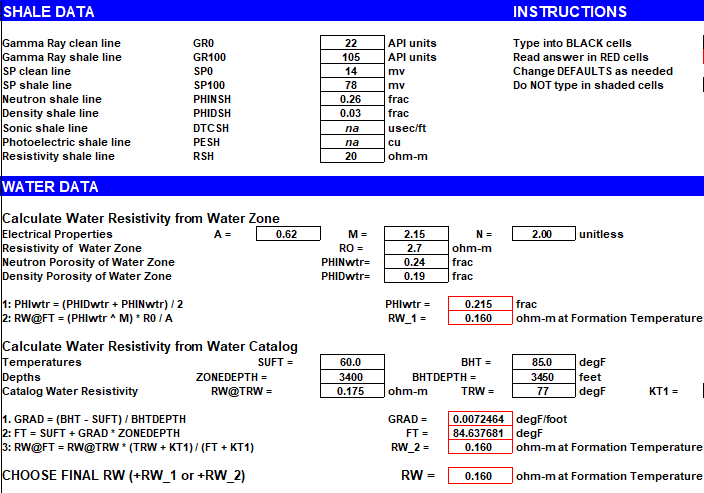
A scan of the Rwa column shows the RW @ FT in the
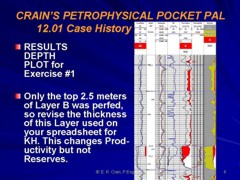
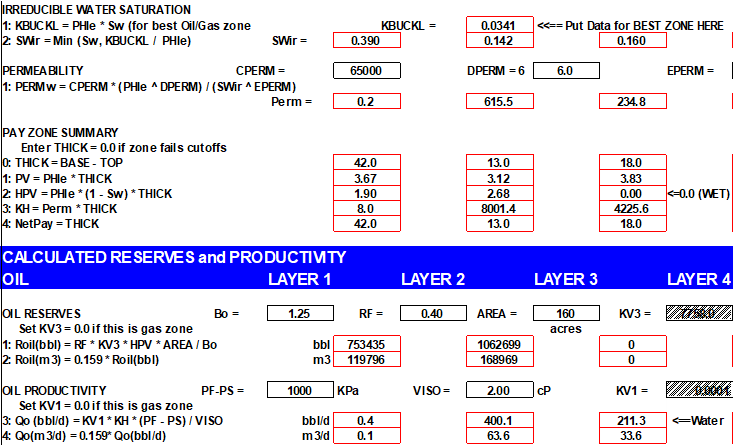
water zone to be 0.17 ohm-m. Reserves and productivity are
useful by-products of this analysis. For example, estimated
productivity for the upper shaly sand is only 0.6 barrels per
day compared to 231 for the clean sand. The shaly sand would be
uneconomic anywhere, but an exploration play may be developed to
find cleaner sands nearby.
The META/LOG cash flow analysis for this well was
given earlier in
Section 11.02.
Summary log and core data listings for Shaly Sand
Example
When you analyze the logs on any well, or group
of wells, you must learn all there is to know about the wells or
offset wells before you start the job. You also must check your
work against ground truth before you finish the job. Below is a
copy of the well history printout for this case history.
Formation tops, cored and perforated intervals, and test
information are the first clues that help narrow the zones of
interest.
WELL HISTORY INFO
Pancanadian Frisco Countess 02-18-18-15W4
KB Elev:
2600.2 ft Logs: DIL-SP, FDC-CNL-GR
Log
depths in FEET
PRODUCTION
HISTORY
Production history for Shaly Sand Example
Production history shows excessive drawdown in
Year 4 probably hastened water breakthrough in Year 5 which
remained constant while oil declined gracefully to economic
limit. Initial production rate normalized for hours of operation
was nearly 100 bbl/day. Cumulative oil was 187 000 bbl (29 700
m3) and water was 1.2 million barrels (190 000 m3). The log
analysis predictions were quite optimistic (300+ bbl/day and 700
000+ bbl recoverable). This knowledge would allow us to adjust
parameters on future wells to obtain better agreement.
CORE ANALYSIS FOR 02-18-18-15W4
|
02181815W4 |
#23708 |
731011 |
|
NOTE: Accumap has Kvert in K90 Column |
|
S# |
Top |
Base |
Len |
Kmax |
K90 |
Kvert |
Poros |
GrDen |
BkDen |
Soil |
Swtr |
Lithology |
|
|
feet |
feet |
feet |
mD |
mD |
mD |
Frac |
kg/m3 |
kg/m3 |
frac |
frac |
|
|
1 |
3499.19 |
3500.17 |
0.98 |
742.0 |
0.0 |
180.0 |
0.283 |
0 |
0 |
0.129 |
0.448 |
SS VF-F |
|
2 |
3500.17 |
3501.16 |
0.98 |
1196.0 |
0.0 |
694.0 |
0.297 |
0 |
0 |
0.123 |
0.450 |
SS VF-F |
|
3 |
3501.16 |
3502.17 |
1.02 |
622.0 |
0.0 |
266.0 |
0.276 |
0 |
0 |
0.111 |
0.520 |
SS VF-F |
|
4 |
3502.17 |
3503.16 |
0.98 |
223.0 |
0.0 |
50.5 |
0.271 |
0 |
0 |
0.129 |
0.479 |
SS VF-F |
|
5 |
3503.16 |
3503.88 |
0.72 |
837.0 |
0.0 |
171.0 |
0.278 |
0 |
0 |
0.110 |
0.504 |
SS VF-F PY |
|
6 |
3503.88 |
3504.57 |
0.69 |
407.0 |
0.0 |
113.0 |
0.287 |
0 |
0 |
0.118 |
0.466 |
SS VF-F |
|
7 |
3504.57 |
3504.67 |
0.10 |
|
0.0 |
0.0 |
0 |
0 |
0 |
0 |
0 |
SH |
|
8 |
3504.67 |
3505.26 |
0.59 |
514.0 |
0.0 |
365.0 |
0.253 |
0 |
0 |
0.151 |
0.398 |
|
|
9 |
3505.26 |
3505.49 |
0.23 |
100.0 |
0.0 |
2.6 |
0.201 |
0 |
0 |
0.134 |
0.358 |
SS VF-F SH INC |
|
10 |
3505.49 |
3505.98 |
0.49 |
401.0 |
0.0 |
120.0 |
0.254 |
0 |
0 |
0.143 |
0.268 |
SS VF-F SHBKS |
|
11 |
3505.98 |
3506.96 |
0.98 |
478.0 |
0.0 |
302.0 |
0.282 |
0 |
0 |
0.131 |
0.471 |
SS VF-F |
|
12 |
3506.96 |
3507.88 |
0.92 |
431.0 |
0.0 |
100.0 |
0.243 |
0 |
0 |
0.156 |
0.399 |
SS VF-F CARB INC |
|
13 |
3507.88 |
3508.47 |
0.59 |
777.0 |
0.0 |
556.0 |
0.277 |
0 |
0 |
0.119 |
0.389 |
SS VF-F |
|
14 |
3508.47 |
3508.87 |
0.39 |
831.0 |
0.0 |
383.0 |
0.275 |
0 |
0 |
0.136 |
0.422 |
SS VF-F CARB BK |
|
15 |
3508.87 |
3509.88 |
1.02 |
413.0 |
0.0 |
262.0 |
0.281 |
0 |
0 |
0.132 |
0.440 |
SS VF-F |
|
16 |
3509.88 |
3510.87 |
0.98 |
604.0 |
0.0 |
425.0 |
0.277 |
0 |
0 |
0.131 |
0.323 |
SS VF-F SH INC |
|
17 |
3510.87 |
3511.88 |
1.02 |
320.0 |
0.0 |
35.1 |
0.229 |
0 |
0 |
0.146 |
0.422 |
SS VF-F SH INC |
|
18 |
3511.88 |
3512.87 |
0.98 |
616.0 |
0.0 |
437.0 |
0.239 |
0 |
0 |
0.103 |
0.354 |
SS VF-F |
|
19 |
3512.87 |
3513.79 |
0.92 |
259.0 |
0.0 |
62.0 |
0.261 |
0 |
0 |
0.073 |
0.418 |
SS VF-F |
|
20 |
3513.79 |
3514.38 |
0.59 |
320.0 |
0.0 |
26.8 |
0.219 |
0 |
0 |
0.096 |
0.441 |
|
|
21 |
3514.38 |
3515.07 |
0.69 |
431.0 |
0.0 |
82.5 |
0.236 |
0 |
0 |
0.119 |
0.387 |
SS VF-F |
|
22 |
3515.07 |
3515.16 |
0.10 |
|
0.0 |
0.0 |
|
|
|
|
|
SH PY |
|
23 |
3515.16 |
3516.18 |
1.02 |
969.0 |
0.0 |
628.0 |
0.270 |
0 |
0 |
0.044 |
0.492 |
SS VF-F |
|
24 |
3516.18 |
3516.77 |
0.59 |
837.0 |
0.0 |
634.0 |
0.280 |
0 |
0 |
0.042 |
0.501 |
SS VF-F |
|
25 |
3516.77 |
3517.46 |
0.69 |
556.0 |
0.0 |
201.0 |
0.273 |
0 |
0 |
0.050 |
0.531 |
SS VF-F CARB INC |
|
26 |
3517.46 |
3518.28 |
0.82 |
706.0 |
0.0 |
338.0 |
0.262 |
0 |
0 |
0.046 |
0.487 |
SS VF-F |
|
27 |
3518.28 |
3519.07 |
0.79 |
502.0 |
0.0 |
377.0 |
0.238 |
0 |
0 |
0.079 |
0.494 |
SS VF-F CARB INC |
|
28 |
3519.07 |
3519.99 |
0.92 |
1136.0 |
0.0 |
183.0 |
0.263 |
0 |
0 |
0.063 |
0.501 |
SS VF-F |
|
29 |
3519.99 |
3520.58 |
0.59 |
825.0 |
0.0 |
291.0 |
0.265 |
0 |
0 |
0.052 |
0.563 |
|
|
30 |
3520.58 |
3521.46 |
0.89 |
1346.0 |
0.0 |
706.0 |
0.274 |
0 |
0 |
0.055 |
0.516 |
SS VF-F |
|
31 |
3521.46 |
3522.48 |
1.02 |
389.0 |
0.0 |
102.0 |
0.246 |
0 |
0 |
0.064 |
0.450 |
SS VF-F/M CARB INC |
|
32 |
3522.48 |
3523.47 |
0.98 |
165.0 |
0.0 |
11.9 |
0.219 |
0 |
0 |
0.058 |
0.408 |
SS VF-F/M CARB INC |
|
33 |
3523.47 |
3524.48 |
1.02 |
586.0 |
0.0 |
66.0 |
0.219 |
0 |
0 |
0.082 |
0.411 |
|
|
34 |
3524.48 |
3525.47 |
0.98 |
1035.0 |
0.0 |
395.0 |
0.244 |
0 |
0 |
0.051 |
0.391 |
SS VF-F |
|
35 |
3525.47 |
3526.48 |
1.02 |
514.0 |
0.0 |
187.0 |
0.199 |
0 |
0 |
0.073 |
0.360 |
|
|
36 |
3526.48 |
3527.47 |
0.98 |
526.0 |
0.0 |
89.0 |
0.205 |
0 |
0 |
0.046 |
0.481 |
SS VF-M |
|
37 |
3527.47 |
3528.16 |
0.69 |
1375.0 |
0.0 |
208.0 |
0.216 |
0 |
0 |
0.042 |
0.548 |
SS VF-M PY CARB |
|
38 |
3528.16 |
3528.88 |
0.72 |
287.0 |
0.0 |
95.0 |
0.207 |
0 |
0 |
0.066 |
0.462 |
|
|
|
|
|
|
|
|
|
|
|
|
|
|
|
|
Arithmetic Averages |
0.78 |
618.8 |
0.0 |
240.7 |
0.253 |
0.0 |
0.0 |
0.095 |
0.443 |
|
|
|
|
|
|
|
|
|
|
|
|
|
|
|
Core data listing for Shaly Sand Example (but see next
illustration)
The average porosity is 25.3% and average
permeability is 624 md. The porosity is higher than the log
analysis shown earlier and the log results could be made to
match the core by reducing shale volume or shifting the density
porosity to a higher value. This would be an arbitrary
calibration shift as there is no evidence that the log is mis-calibrated.
Some one may have noticed this problem at some stage because a
second core analysis listing is available, dated several years
after the first one. The re-analysis is shown below.
REVISED CORE ANALYSIS FOR 02-18-18-15W4
|
02181815W4R |
#27771 |
780118 |
|
Revised Analysis - Soil and Swtr from
Original Analysis |
|
S# |
Top |
Base |
Len |
Kmax |
K90 |
Kvert |
Poros |
GrDen |
BkDen |
Soil |
Swtr |
Lithology |
|
|
feet |
feet |
feet |
mD |
mD |
mD |
frac |
kg/m3 |
kg/m3 |
frac |
frac |
|
|
1 |
3499.19 |
3500.17 |
0.98 |
370.0 |
316.0 |
264.0 |
0.255 |
2850 |
2378 |
0.129 |
0.448 |
SS VF |
|
2 |
3500.17 |
3501.16 |
0.98 |
445.0 |
425.0 |
326.0 |
0.248 |
2680 |
2263 |
0.123 |
0.450 |
SS VF |
|
3 |
3501.16 |
3502.17 |
1.02 |
764.0 |
751.0 |
231.0 |
0.248 |
2670 |
2256 |
0.111 |
0.520 |
SS VF |
|
4 |
3502.17 |
3503.16 |
0.98 |
445.0 |
417.0 |
127.0 |
0.234 |
2670 |
2279 |
0.129 |
0.479 |
SS VF |
|
5 |
3503.16 |
3503.88 |
0.72 |
479.0 |
411.0 |
84.0 |
0.241 |
2700 |
2290 |
0.110 |
0.504 |
SS VF PRY |
|
6 |
3503.88 |
3504.57 |
0.69 |
860.0 |
790.0 |
172.0 |
0.242 |
2680 |
2273 |
0.118 |
0.466 |
SS VF |
|
7 |
3504.57 |
3504.67 |
0.10 |
|
0.1 |
0.1 |
|
|
|
|
|
SHALE |
|
8 |
3504.67 |
3505.26 |
0.59 |
|
0.1 |
0.1 |
|
|
|
0.151 |
0.398 |
RUBBLE |
|
9 |
3505.26 |
3505.49 |
0.23 |
486.0 |
402.0 |
261.0 |
0.246 |
2670 |
2259 |
0.134 |
0.358 |
SS VF SH INC |
|
10 |
3505.49 |
3505.98 |
0.49 |
355.0 |
326.0 |
8.3 |
0.207 |
2640 |
2301 |
0.143 |
0.268 |
SS VF SHBKS |
|
11 |
3505.98 |
3506.96 |
0.98 |
376.0 |
192.0 |
32.2 |
0.240 |
2650 |
2254 |
0.131 |
0.471 |
SS VF |
|
12 |
3506.96 |
3507.88 |
0.92 |
250.0 |
245.0 |
17.6 |
0.218 |
2640 |
2282 |
0.156 |
0.399 |
SS VF CARB INC |
|
13 |
3507.88 |
3508.47 |
0.59 |
491.0 |
0.1 |
0.1 |
0.237 |
|
|
0.119 |
0.389 |
SS VF |
|
14 |
3508.47 |
3508.87 |
0.39 |
304.0 |
0.1 |
0.1 |
0.219 |
|
|
0.136 |
0.422 |
SS VF CARB BK |
|
15 |
3508.87 |
3509.88 |
1.02 |
309.0 |
288.0 |
127.0 |
0.230 |
2850 |
2425 |
0.132 |
0.440 |
SS VF |
|
16 |
3509.88 |
3510.87 |
0.98 |
845.0 |
340.0 |
135.0 |
0.237 |
2660 |
2267 |
0.131 |
0.323 |
SS VF SH INC |
|
17 |
3510.87 |
3511.88 |
1.02 |
298.0 |
287.0 |
75.3 |
0.218 |
2650 |
2290 |
0.146 |
0.422 |
SS VF SH INC |
|
18 |
3511.88 |
3512.87 |
0.98 |
139.0 |
0.1 |
0.1 |
0.208 |
2650 |
2307 |
0.103 |
0.354 |
SS VF |
|
19 |
3512.87 |
3513.79 |
0.92 |
139.0 |
0.1 |
0.1 |
0.174 |
|
|
0.073 |
0.418 |
SS VF |
|
20 |
3513.79 |
3514.38 |
0.59 |
|
0.1 |
0.1 |
|
|
|
0.096 |
0.441 |
RUBBLE |
|
21 |
3514.38 |
3515.07 |
0.69 |
65.1 |
0.1 |
0.1 |
0.257 |
|
|
0.119 |
0.387 |
SS VF |
|
22 |
3515.07 |
3515.16 |
0.10 |
|
0.1 |
0.1 |
|
|
|
|
|
SHALE |
|
23 |
3515.16 |
3516.18 |
1.02 |
1050.0 |
385.0 |
385.0 |
0.254 |
2670 |
2246 |
0.044 |
0.492 |
SS VF |
|
24 |
3516.18 |
3516.77 |
0.59 |
385.0 |
471.0 |
471.0 |
0.220 |
2660 |
2295 |
0.042 |
0.501 |
SS VF |
|
25 |
3516.77 |
3517.46 |
0.69 |
835.0 |
183.0 |
183.0 |
0.237 |
2670 |
2274 |
0.050 |
0.531 |
SS VF CARB INC |
|
26 |
3517.46 |
3518.28 |
0.82 |
901.0 |
644.0 |
644.0 |
0.238 |
2650 |
2257 |
0.046 |
0.487 |
SS VF |
|
27 |
3518.28 |
3519.07 |
0.79 |
438.0 |
103.0 |
103.0 |
0.240 |
2690 |
2284 |
0.079 |
0.494 |
SS VF CARB INC |
|
28 |
3519.07 |
3519.99 |
0.92 |
1430.0 |
278.0 |
278.0 |
0.251 |
2660 |
2243 |
0.063 |
0.501 |
SS VF |
|
29 |
3519.99 |
3520.58 |
0.59 |
|
0.1 |
0.1 |
|
|
|
0.052 |
0.563 |
RUBBLE |
|
30 |
3520.58 |
3521.46 |
0.89 |
1050.0 |
951.0 |
951.0 |
0.258 |
2570 |
2165 |
0.055 |
0.516 |
SS VF |
|
31 |
3521.46 |
3522.48 |
1.02 |
382.0 |
61.5 |
61.5 |
0.210 |
2690 |
2335 |
0.064 |
0.450 |
SS M P/SCARB INC |
|
32 |
3522.48 |
3523.47 |
0.98 |
570.0 |
48.9 |
48.9 |
0.186 |
2680 |
2368 |
0.058 |
0.408 |
SS M P/SCARB INC |
|
33 |
3523.47 |
3524.48 |
1.02 |
|
0.1 |
0.1 |
|
|
|
0.082 |
0.411 |
RUBBLE |
|
34 |
3524.48 |
3525.47 |
0.98 |
3149.0 |
321.0 |
321.0 |
0.209 |
2590 |
2258 |
0.051 |
0.391 |
SS VF |
|
35 |
3525.47 |
3526.48 |
1.02 |
|
0.1 |
0.1 |
|
|
|
0.073 |
0.360 |
RUBBLE |
|
36 |
3526.48 |
3527.47 |
0.98 |
285.0 |
48.8 |
18.8 |
0.170 |
2690 |
2403 |
0.046 |
0.481 |
SS M P/S |
|
37 |
3527.47 |
3528.16 |
0.69 |
193.0 |
0.1 |
0.1 |
0.169 |
2770 |
2471 |
0.042 |
0.548 |
SS M P/S CARB |
|
38 |
3528.16 |
3528.88 |
0.72 |
|
0.1 |
0.1 |
|
|
|
0.066 |
0.462 |
RUBBLE |
|
|
|
|
|
|
|
|
|
|
|
|
|
|
|
Arithmetic Averages |
0.78 |
602.9 |
228.6 |
140.2 |
0.227 |
2679 |
2297 |
0.095 |
0.443 |
|
|
|
|
|
|
|
|
|
|
|
|
|
|
|
Re-analyzed core data listings for Shaly Sand Example
Notice that the average porosity is 22.7% instead
of 25.3%, much closer to the original log analysis. Permeability
has changed only slightly from the first core analysis. The
moral of the story is that core analysis is not perfect and some
errors should be expected. Checking log analysis in several
cored wells is the only way to find the odd bad core or bad log.
Core data crossplots for Shaly Sand Example
The crossplots of the original and revised core
analysis data are shown above. The revised analysis gives
considerably higher permeability for any given porosity.
|